the MathsLinks network
Links
(current)
Faculty
Kit
Starters
Sign up for free
Sign in
Maths
Links
A directory of useful objects found on the web for teaching Maths.
Home
Browse
(current)
Topic
Australian Curriculum
NSW Curriculum
My Favourites
My Lists
Submit a link
Help
Search
Browsing by
Topic Categories
Data
Topic:
Data Analysis
Showing:
All
Links
Downloads
1
2
3
Next Page
‘Mean and Average Song’ by Heath
2.3 Children
5 Examples of Negatively Skewed Distributions
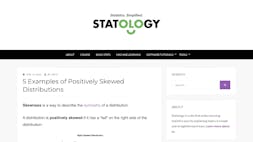
5 Examples of Positively Skewed Distributions
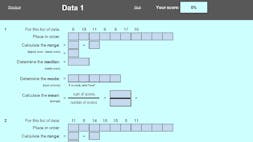
Analysing Data
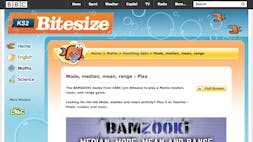
BAMZOOKi - Mode, median, mean, range
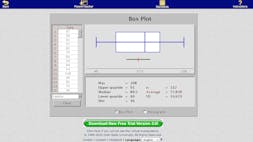
Box Plot/Histogram
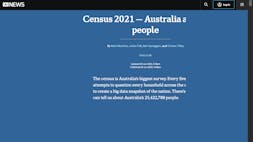
Census 2021 — Australia as 100 people
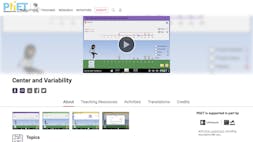
Center and Variability
1
2
3
Next Page
Sign in
×
Email address
Password
Keep me signed in
Sign in
Get updates…
Email newsletter
Facebook
Twitter
Topics
Number
Patterns and Algebra
Data
Measurement
Space and Geometry
more …
Syllabus
Australian Curriculum
NSW Syllabus