Advanced Data Grapher
https://illuminations.nctm.org/Activity.aspx?id=3476
Adobe Flash
This resource required Adobe Flash and will no longer work.Adobe no longer supports Flash Player after 31 December 2020 and blocked Flash content from running in Flash Player beginning 12 January 2021. read more
Links requiring Flash have not yet been removed from MathsLinks. I hope that some resources will be re-produced using modern supported technologies.
Tool, NCTM Illuminations
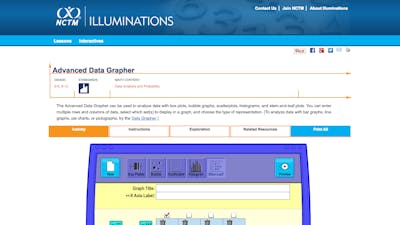
The Advanced Data Grapher can be used to analyze data with box plots, bubble graphs, scatterplots, histograms, and stem-and-leaf plots. You can enter multiple rows and columns of data, select which set(s) to display in a graph, and choose the type of representation.
3 April 2017 Edit: 4 April 2017
- Content Type:
- Tool, NCTM Illuminations
- The Australian Curriculum
- ACMSP170 Year 7 Construct and compare a range of data displays including stem-and-leaf plots and dot, ACMSP249 Year 10 Construct and interpret box plots and use them to compare data sets, ACMSP250 Year 10 Compare shapes of box plots to corresponding histograms and dot plots
- The Australian Curriculum Version 9.0 New
- Year 7, Statistics Year 7, AC9M7ST02 create different types of numerical data displays including stem-and-leaf plots using soft, Year 10, Statistics Year 10, AC9M10ST02 compare data distributions for continuous numerical variables using appropriate data disp
- Australian Curriculum / General Mathematics
- Unit 2 Topic 1 Univariate data analysis and the statistical investigation process, Making sense of data relating to a single statistical variable, ACMGM029 with the aid of an appropriate graphical display (chosen from dot plot, stem plot, ba…
- NSW Mathematics K-10 Syllabus
- MA4-19SP Data Collection and Representation, MA5.1-12SP Single Variable Data Analysis, MA5.2-15SP Single Variable Data Analysis, MA5.2-16SP Bivariate Data Analysis
- NSW Curriculum New
- Statistics and probability, Data classification, visualisation and analysis, MA4-DAT-C-01 Data classification and visualisation, MA5-DAT-C-01 Data analysis A, MA5-DAT-C-02 Data analysis B
- NSW Mathematics Standard Stage 6 Syllabus
- Statistical Analysis, MS-S1 Data Analysis, MS-S4 Bivariate Data Analysis
Submit a correction to this link
Comments
How have you used this link in your classroom? Share your teaching ideas or leave a review about this link.
Sign in to leave a comment.
There are no comments for this link.