Browsing by The Australian Curriculum
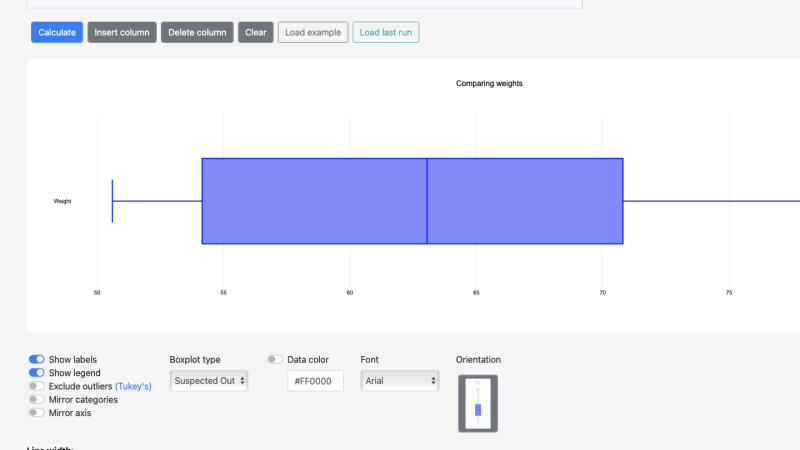
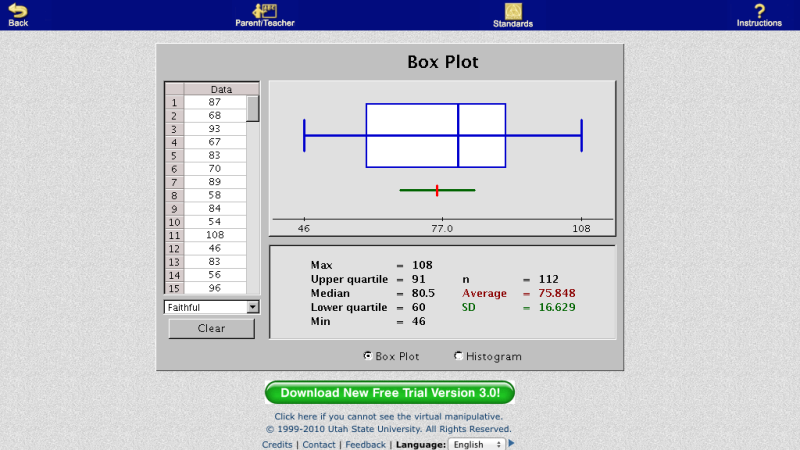
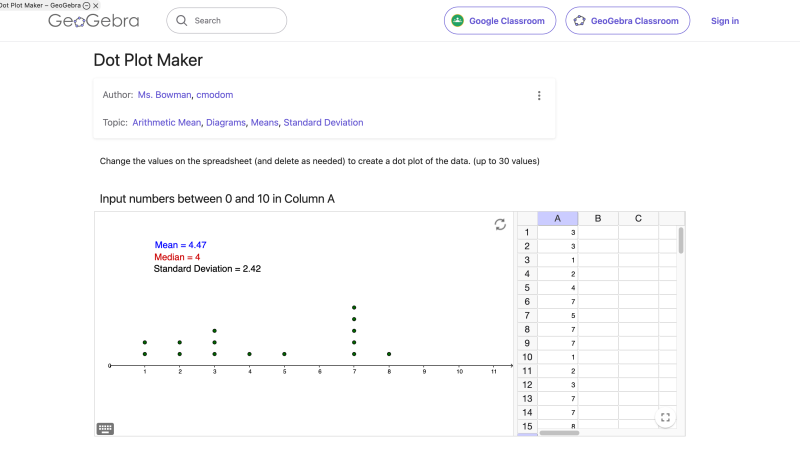
Compare shapes of box plots to corresponding histograms and dot plots (ACMSP250) * Investigating data in different ways to make comparisons and draw conclusions
A directory of useful objects found on the web for teaching Maths.
Compare shapes of box plots to corresponding histograms and dot plots (ACMSP250) * Investigating data in different ways to make comparisons and draw conclusions