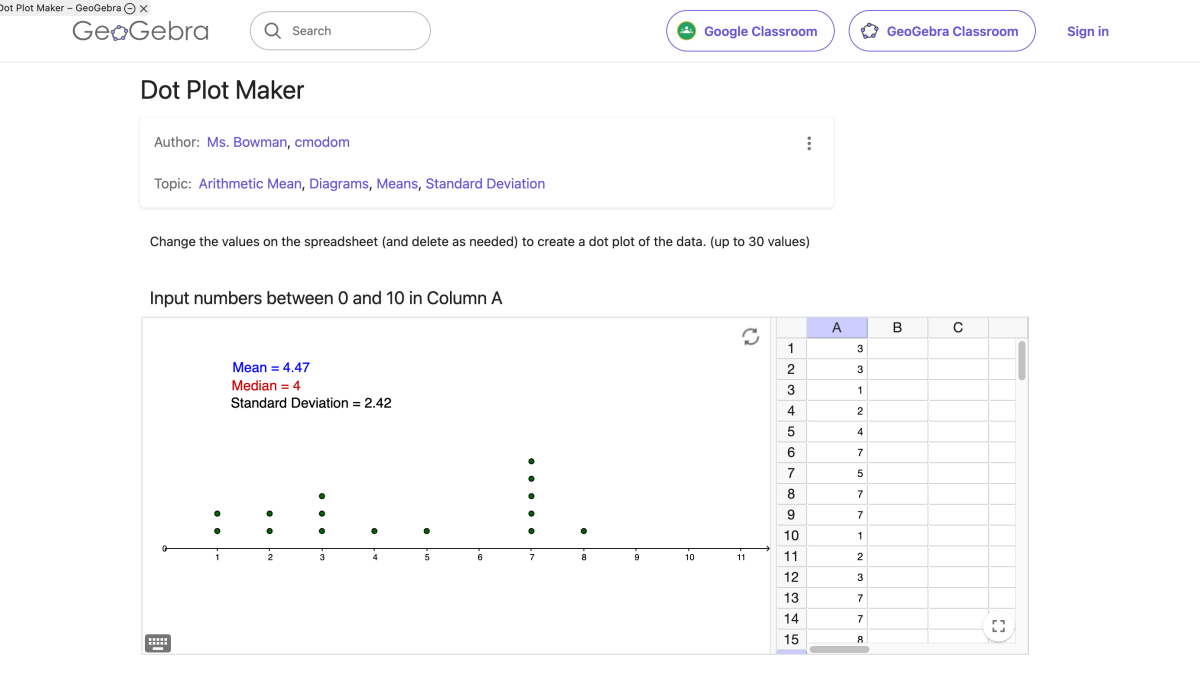
Dot Plot Maker
https://www.geogebra.org/m/BxqJ4Vag
Interactive, Tool
Change the values on the spreadsheet (and delete as needed) to create a dot plot of the data. (up to 30 values)
8 August 2024 Edit: 8 August 2024
- Topics:
- Data, Data Representation, Dot Plot
- Content Type:
- Interactive, Tool
- The Australian Curriculum
- Statistics and Probability, Data representation and interpretation, ACMSP119 Year 5 Construct displays, including column graphs, dot plots and tables, appropriate for d, ACMSP170 Year 7 Construct and compare a range of data displays including stem-and-leaf plots and dot, ACMSP250 Year 10 Compare shapes of box plots to corresponding histograms and dot plots
- The Australian Curriculum Version 9.0
- Year 6, Statistics Year 6, AC9M6ST01 interpret and compare data sets for ordinal and nominal categorical, discrete and continuo, Year 7, Statistics Year 7, AC9M7ST02 create different types of numerical data displays including stem-and-leaf plots using soft, Year 9, Statistics Year 9, AC9M9ST04 choose appropriate forms of display or visualisation for a given type of data; justify sel, Year 10, Statistics Year 10, AC9M10ST02 compare data distributions for continuous numerical variables using appropriate data disp
- NSW Curriculum K - 10
- Statistics and probability, Data, MA2-DATA Data, MA2-DATA-02 Data, Data classification, visualisation and analysis, MA4-DAT-C-01 Data classification and visualisation
- NSW Mathematics Standard Stage 6 Syllabus
- Statistical Analysis, MS-S1 Data Analysis, MS-S1.1 Classifying and representing data (grouped and ungrouped)
- NSW Mathematics Standard 11-12 Syllabus (2024) New
- Statistics, Data analysis, Data classification
Submit a correction to this link
Comments
How have you used this link in your classroom? Share your teaching ideas or leave a review about this link.
Sign in to leave a comment.
There are no comments for this link.