the MathsLinks network
Links
(current)
Faculty
Kit
Starters
Sign up for free
Sign in
Maths
Links
A directory of useful objects found on the web for teaching Maths.
Home
Browse
(current)
Topic
Australian Curriculum
NSW Curriculum
My Favourites
My Lists
Submit a link
Help
Search
Browsing by
Content Type
Topic:
Tool
Sub-topics:
Graphing
(3)
Showing:
All
Links
Downloads
1
2
3
Next Page
A Maths Dictionary for Kids
Addition and subtraction of positive and negative integers - Connect 3
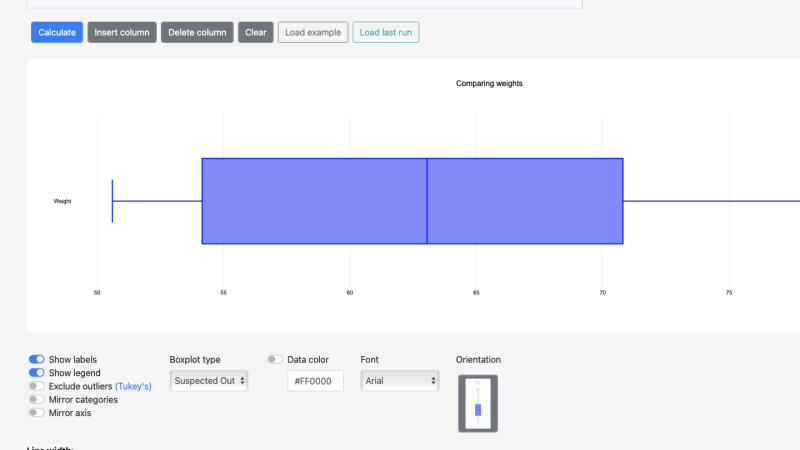
Advanced Boxplot Maker
Algebra Graph Sketcher
Australian Curriculum mathematics glossary
Binary Decimal Hexadecimal Converter
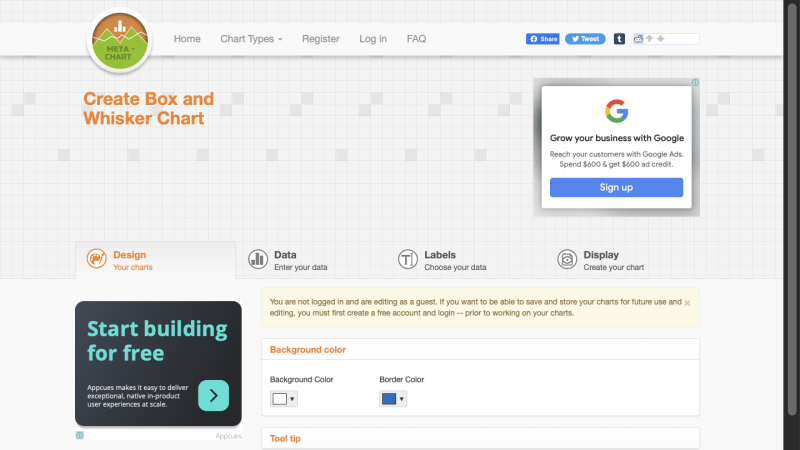
Box and Whisker Plot Maker
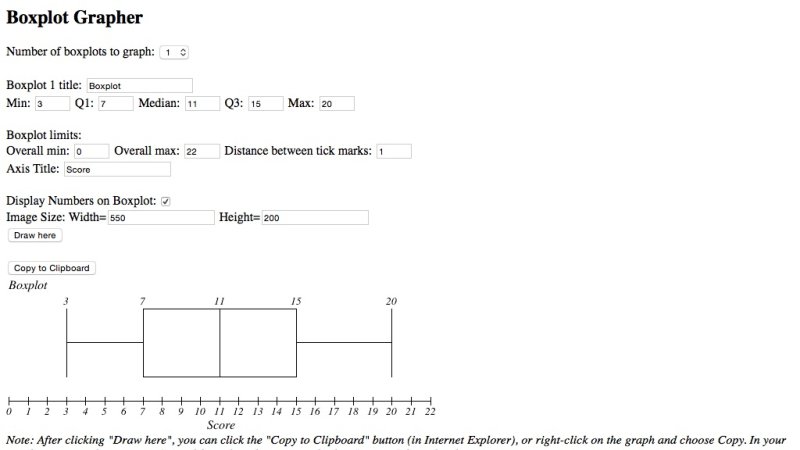
Boxplot Grapher
ChartGizmo
1
2
3
Next Page
Sign in
Email address
Password
Keep me signed in
Sign in
Get updates…
Email newsletter
Facebook
(Twitter)
Blue Sky
Pinterest
Topics
Number
Patterns and Algebra
Data
Measurement
Space and Geometry
more …
Syllabus
Australian Curriculum
NSW Syllabus