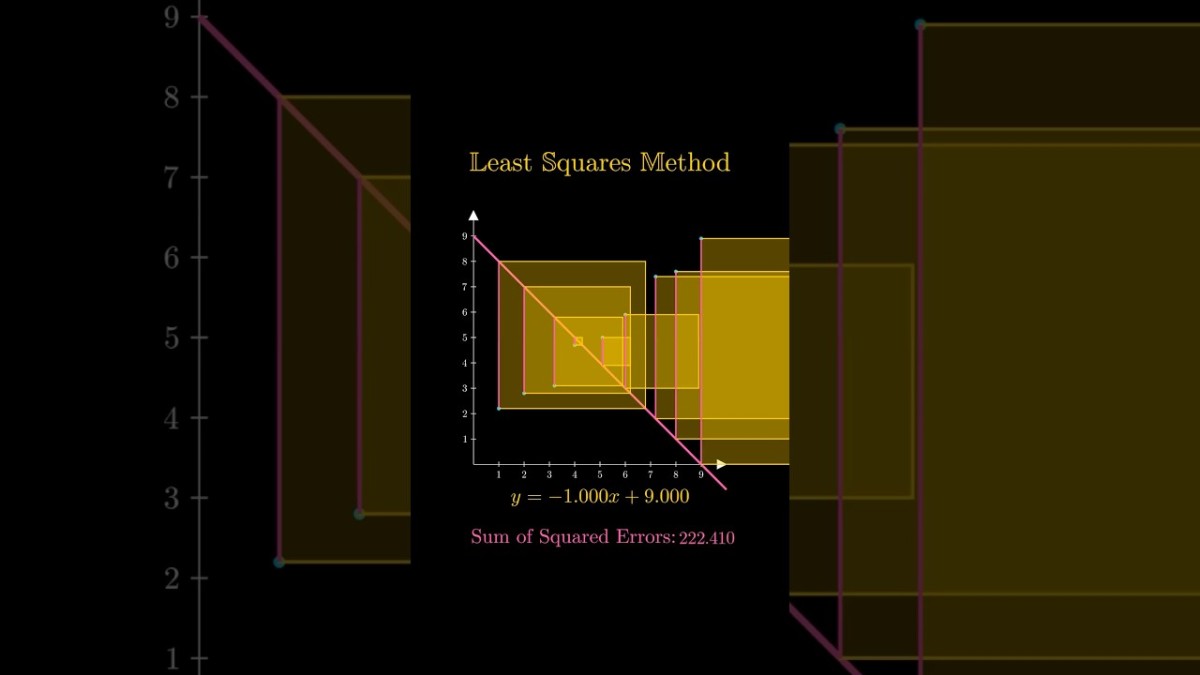
Least squares method visualised
https://www.youtube.com/watch?v=tAMnqXdd9iA
Video, YouTube
A short animation showing the least squares method for finding a regression line.
18 February 2026 Edit: 19 February 2026
- Topics:
- Data, Bivariate data
- NSW Mathematics Standard 11-12 Syllabus (2024) New
- Statistics, Bivariate data analysis, Scatter plots and lines of best fit
Submit a correction to this link | Help align this link to NSW Mathematics Syllabuses align this link to The Australian Curriculum
Comments
How have you used this link in your classroom? Share your teaching ideas or leave a review about this link.
Sign in to leave a comment.
There are no comments for this link.