the MathsLinks network
  • Links (current)
  • Faculty
  • Kit
  • Starters
Sign up for free Sign in

MathsLinks

A directory of useful objects found on the web for teaching Maths.

  • Home
  • Browse (current)
  • My Favourites
  • My Lists
  • Submit a link
  • Help

Browsing by Topic Categories

  1. Topic: Data
  • Showing:
  • All
  • Links
  • Downloads

Sub-topics:  Bivariate data (4)  Box and Whisker Plot (7)  Column Graph (8)  Conversion Graphs (1)  Data Analysis (61)  Data Representation (63)  Interpreting Data (23)  Line Graphs (8)  Misleading Graphs (16)  Picture Graphs (6)  Sector Graphs (Pie Charts) (14)  Standard Deviation (5)  Stem and Leaf Plot (5)  Travel Graphs (1) 

  • 1
  • 2
  • 3
  • Next Page
Screenshot of
‘Mean and Average Song’ by Heath
Screenshot of
2.3 Children
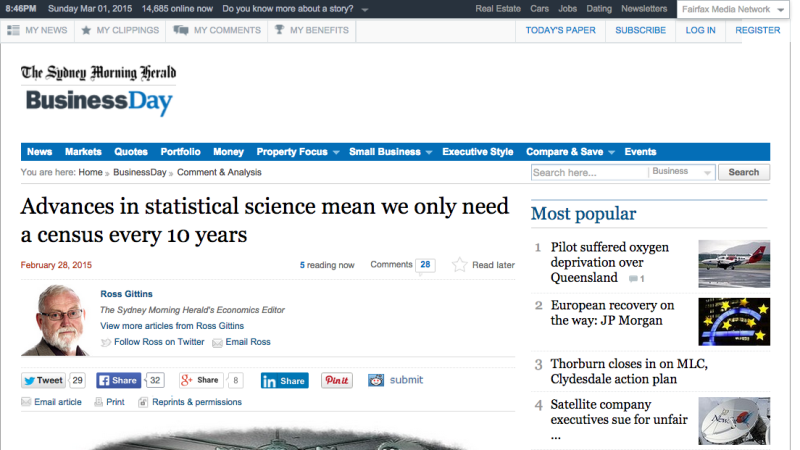
Screenshot of
Advances in statistical science mean we only need a census every 10 years
Preview of
Analysing Data
Screenshot of
Australian Trade & Industry Alliance Carbon Tax Ad
Preview of
Back-to-back Stem-and-leaf plot
Screenshot of
BAMZOOKi - Mode, median, mean, range
Preview of
Blank Pie Charts
Screenshot of
BossMaths
  • 1
  • 2
  • 3
  • Next Page

Sign in

Forgot your password?
Get updates…
Email newsletter Facebook Twitter
Maths at home

Resources for learning maths at home.

Topics
  • Number
  • Patterns and Algebra
  • Data
  • Measurement
  • Space and Geometry
  • more …
Syllabus
  • Australian Curriculum
  • NSW Syllabus

Twitter Facebook Pinterest Subscribe to feed Email newsletter

the MathsLinks network © 2007–2022 Simon Job | Contact | About

Hosted on Dreamhost. Feedpress for RSS feeds with analytics. Overleaf for LaTeX.

This site was created in a private capacity and is not the work of my employer.