Browsing by Australian Curriculum General Mathematics
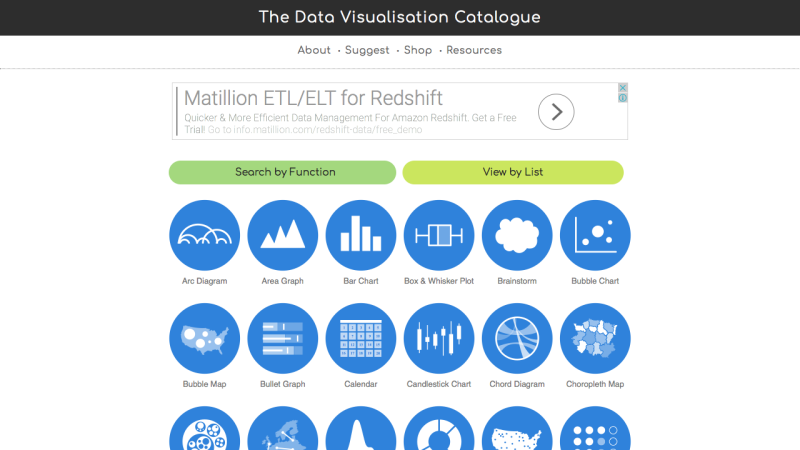
with the aid of an appropriate graphical display (chosen from dot plot, stem plot, bar chart or histogram), describe the distribution of a numerical dataset in terms of modality (uni or multimodal), shape (symmetric versus positively or negatively skewed), location and spread and outliers, and interpret this information in the context of the data
