The Data Visualisation Catalogue
http://www.datavizcatalogue.com/
Reference
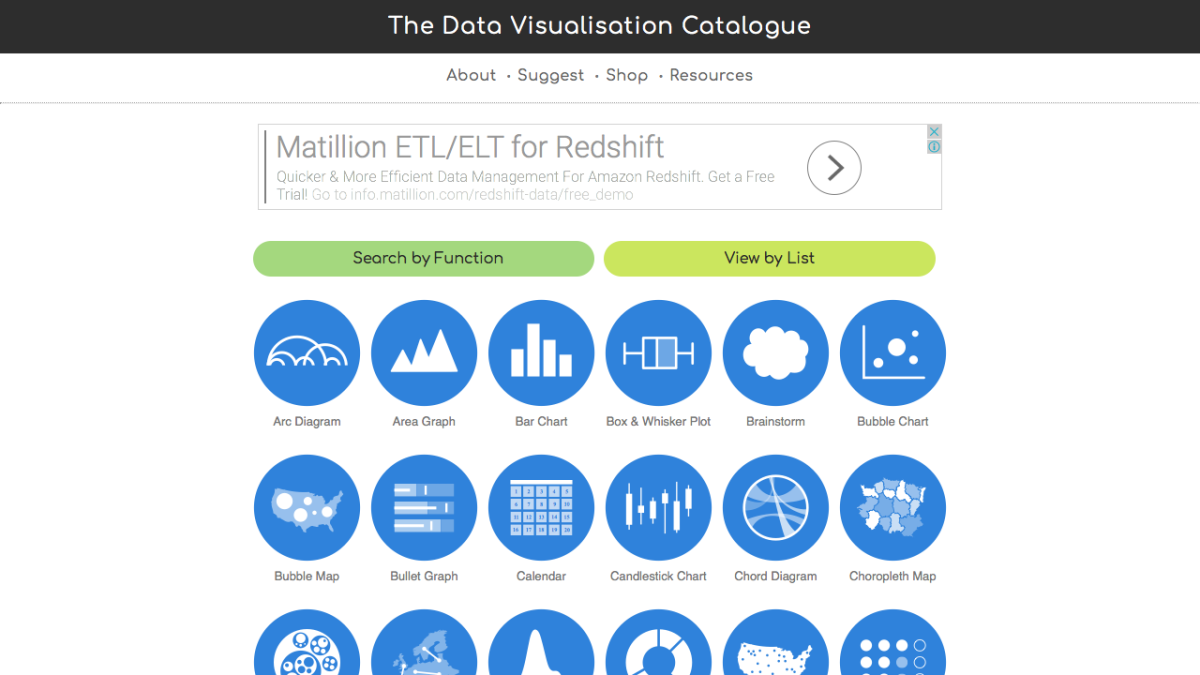
A comprehensive catalogue of data representation tools. Each includes a description and example.
2 April 2017 Edit: 27 November 2019
- Topics:
- Data, Box and Whisker Plot, Column Graph, Data Representation, Line Graphs, Picture Graphs, Sector Graphs (Pie Charts), Stem and Leaf Plot
- Content Type:
- Reference
- The Australian Curriculum
- Number and Algebra, Linear and nonlinear relationships, ACMNA180 Year 7 Investigate, interpret and analyse graphs from authentic data, Statistics and Probability, Data representation and interpretation, ACMSP147 Year 6 Interpret and compare a range of data displays, including side-by-side column graphs, ACMSP172 Year 7 Describe and interpret data displays and the relationship between the median and mea, ACMSP282 Year 9 Construct back-to-back stem-and-leaf plots and histograms and describe data, using t, ACMSP249 Year 10 Construct and interpret box plots and use them to compare data sets
- The Australian Curriculum Version 9.0
- Year 6, Statistics Year 6, AC9M6ST01 interpret and compare data sets for ordinal and nominal categorical, discrete and continuo, Year 7, Algebra Year 7, AC9M7A04 describe relationships between variables represented in graphs of functions from authentic , Statistics Year 7, AC9M7ST01 acquire data sets for discrete and continuous numerical variables and calculate the range,, Year 9, Statistics Year 9, AC9M9ST03 represent the distribution of multiple data sets for numerical variables using comparative, Year 10, Statistics Year 10, AC9M10ST02 compare data distributions for continuous numerical variables using appropriate data disp
- Australian Curriculum / General Mathematics
- Unit 2 Topic 1 Univariate data analysis and the statistical investigation process, Making sense of data relating to a single statistical variable, ACMGM029 with the aid of an appropriate graphical display (chosen from dot plot, stem plot, ba…, Unit 3 Topic 1 Bivariate data analysis, Identifying and describing associations between two numerical variables, ACMGM052 construct a scatterplot to identify patterns in the data suggesting the presence of a…
- NSW Curriculum K - 10
- Statistics and probability, Data classification, visualisation and analysis, MA4-DAT-C-01 Data classification and visualisation, MA4-DAT-C-02 Data analysis, MA5-DAT-C-01 Data analysis A, MA5-DAT-C-02 Data analysis B, MA5-DAT-P-01 Data analysis C (Path)
- NSW Mathematics Standard Stage 6 Syllabus
- Statistical Analysis, MS-S1 Data Analysis, MS-S1.1 Classifying and representing data (grouped and ungrouped), MS-S4 Bivariate Data Analysis
- NSW Mathematics Advanced Stage 6 Syllabus
- Statistical Analysis, MA-S2 Descriptive Statistics and Bivariate Data Analysis, S2.1 Data (grouped and ungrouped) and summary statistics, S2.2 Bivariate data analysis
- NSW Mathematics Standard 11-12 Syllabus (2024) New
- Statistics, Data analysis, Data classification, Bivariate data analysis
- NSW Mathematics Advanced 11-12 Syllabus (2024) New
- Statistical analysis, Data
Submit a correction to this link
Comments
How have you used this link in your classroom? Share your teaching ideas or leave a review about this link.
Sign in to leave a comment.
There are no comments for this link.