Smartie Statistics
Resource Type: Activity, IWB, Projector, Worksheet - Electronic, Worksheet - Print
Looking around, there are lots of activities for collecting and analysing data using small boxes of Smarties. Here is my version.
The package includes three worksheets to scaffold the collection and representation of data:
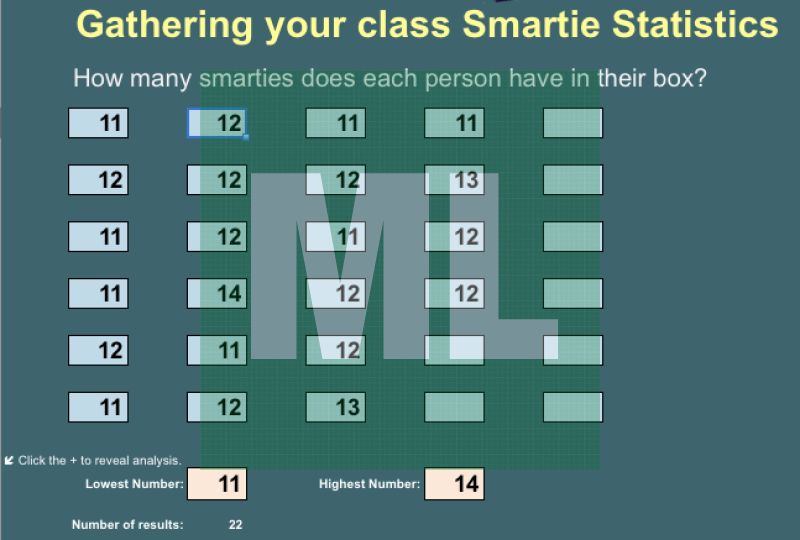
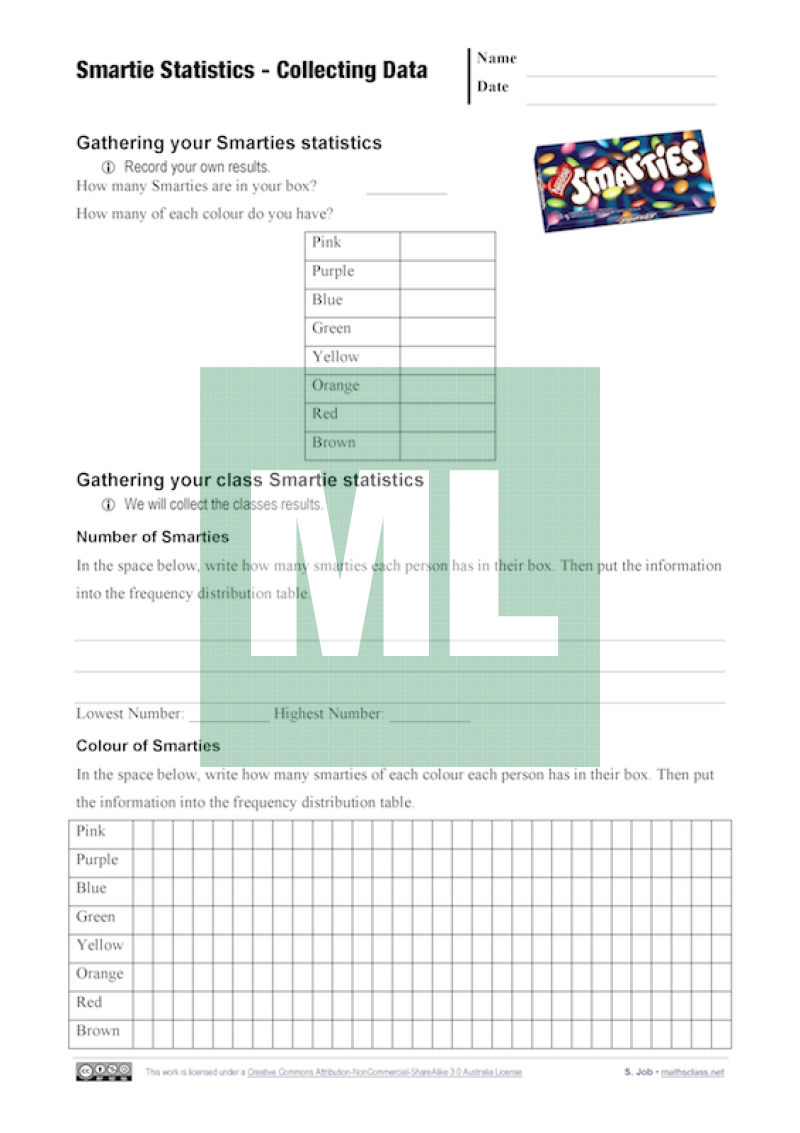
- Collecting Data – this is where the student collects their individual data and records the whole classes data.
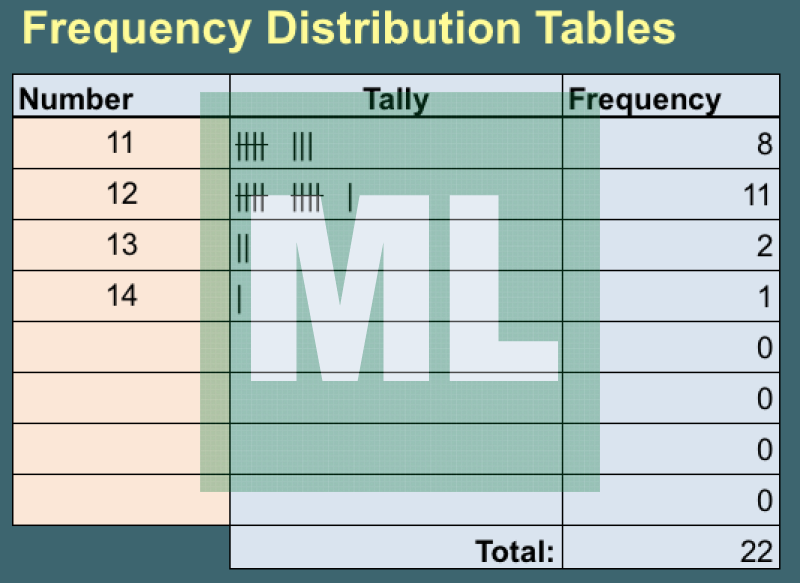
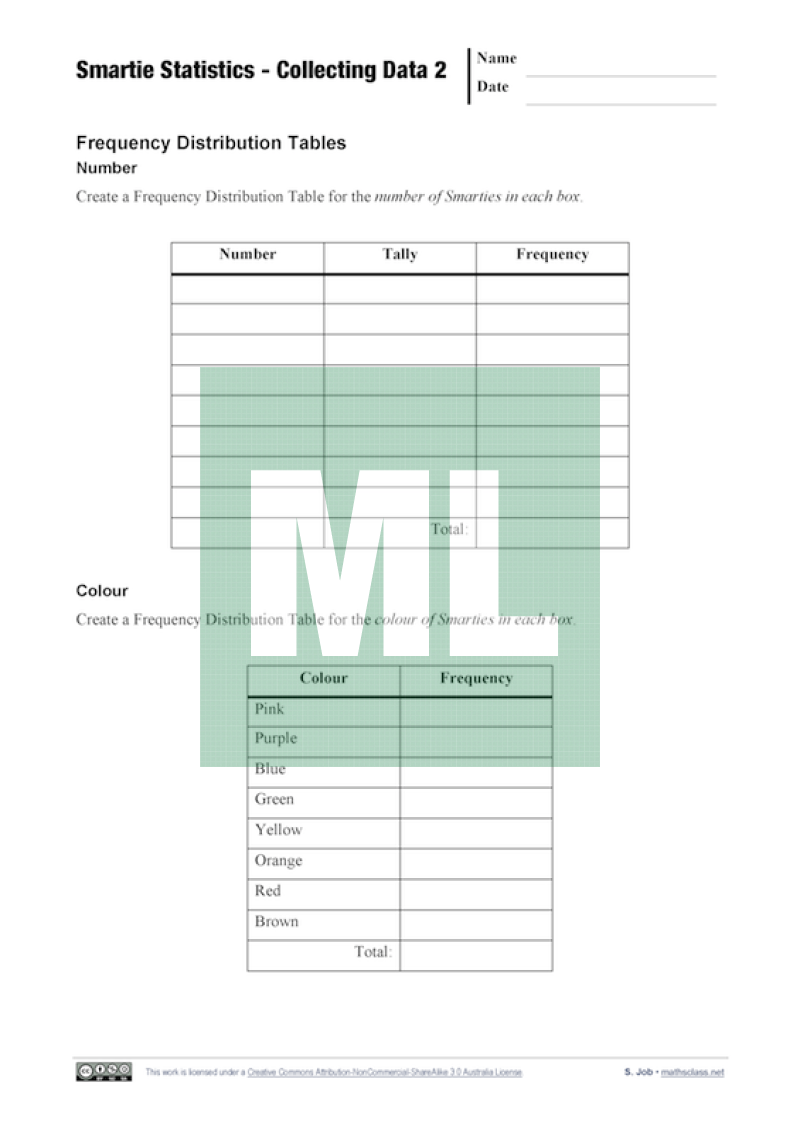
- Collecting Data 2 – students take the whole class data and display in Frequency Distribution Tables.
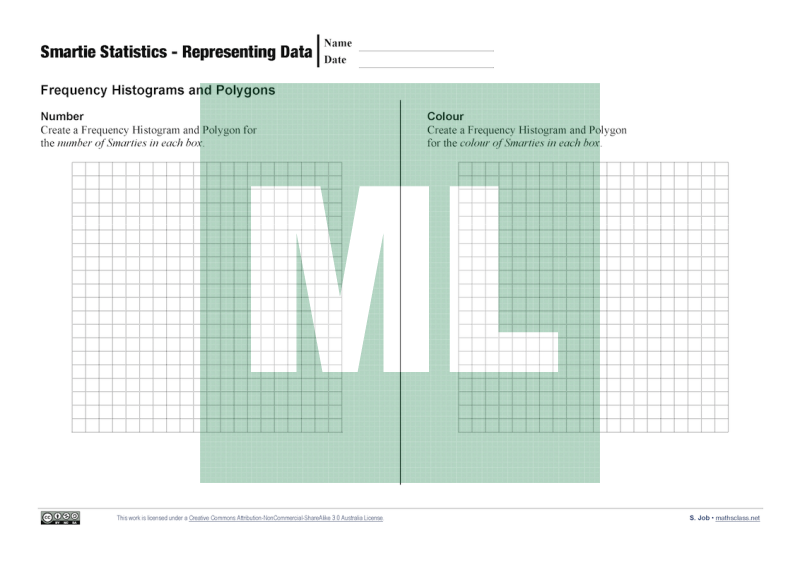
- Representing Data – from the Frequency Distribution Tables, students create Frequency Histograms and Polygons.
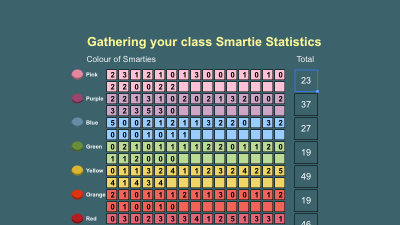
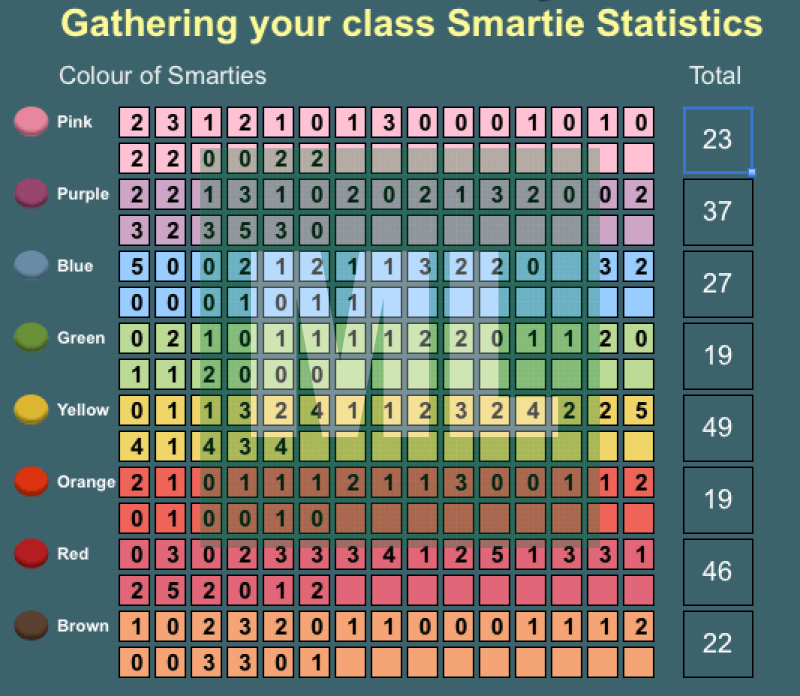
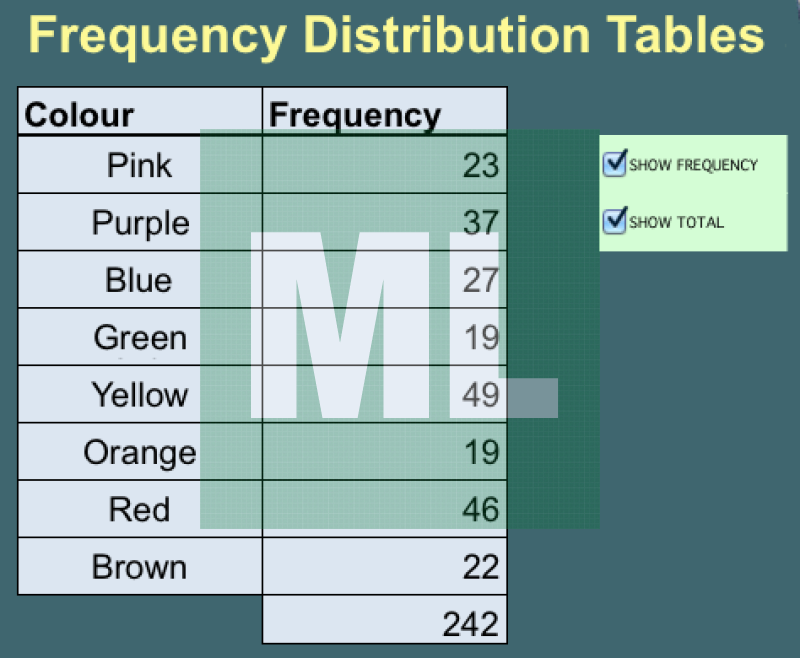
The Excel file is used by the teacher, on a projector/IWB, to collect the data in the class. It allows the teacher to collect the raw data and represent in Frequency Distribution Tables.
2 February 2013 Edit: 28 February 2014
Shared by Simon Job Sydney, Australia
Simon Job has blogged about this resource.
This resource has been shared under a Creative Commons license:
Attribution-Share Alike ![]()
Click thumbnails for selected previews.
Excel, PDF
- Topics:
- Data, Data Analysis, Data Representation
- Resource Type:
- Activity, IWB, Projector, Worksheet - Electronic, Worksheet - Print
Submit a correction to this link
Comments
How have you used this resource in your classroom? Share your teaching ideas or leave a review about this resource.
Sign in to leave a comment.
There are no comments for this resource… yet.