Fatal Traffic, When and Where
http://flowingdata.com/2017/04/27/traffic-fatalities-when-and-where/
Stimulus
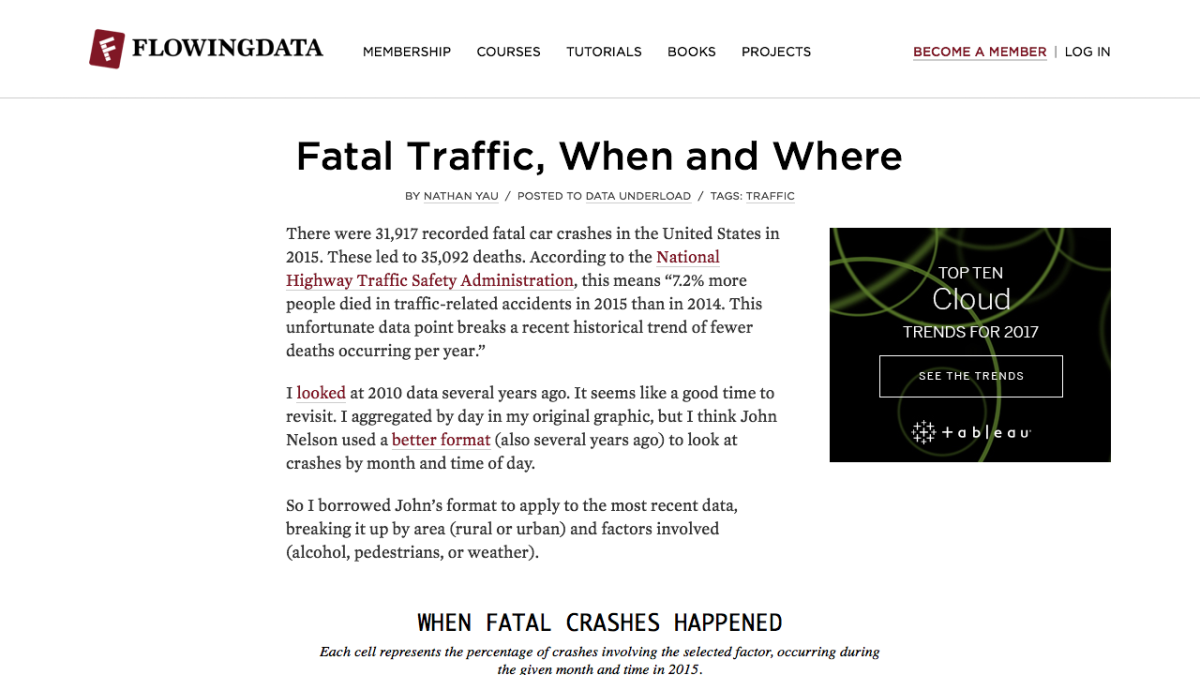
An example of a heat map representing real-world data. Each cell shows the percentage of crashes at that time involving the selected factor. This is for US data.
29 April 2017 Edit: 2 May 2017
- Topics:
- Data, Data Representation, Interpreting Data
- Content Type:
- Stimulus
- Australian Curriculum / Essential Mathematics
- Summarising and interpreting data, ACMEM048 compare the suitability of different methods of data presentation in real-world contexts.
- NSW Mathematics Standard Stage 6 Syllabus
- Statistical Analysis, MS-S1 Data Analysis, MS-S1.1 Classifying and representing data (grouped and ungrouped)
- NSW Mathematics Standard 11-12 Syllabus (2024) New
- Statistics, Data analysis, Data classification
Submit a correction to this link

Comments
How have you used this link in your classroom? Share your teaching ideas or leave a review about this link.
Sign in to leave a comment.
There are no comments for this link.