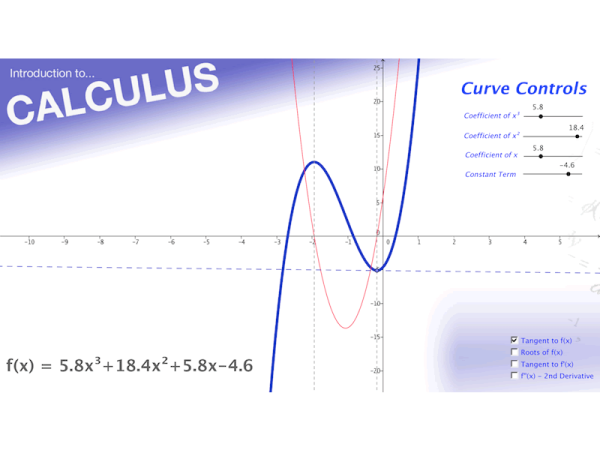
Calculus - The graphic relationship between a curve and its first and second derivative

Resource Type: GeoGebra, Interactive
This is a GeoGebra applet for demonstrating the graphical relationship between a cubic and its first and second derivative.
I have attached a version optimized for 1280x800 resolution, and also a version that is optimized for use on an IWB.
It is a highly visual tool, all of the co-efficients of the cubic curve are controlled via sliders to show the constantly variable relationship between a curve and its derivatives.
The derivative curves (and tangents to these curves) can be turned on and off via a series of checkboxes on the screen. All tangents can be moved around the curves to demonstrate gradients, points of inflexion etc etc.
Download and enjoy!
16 November 2012 Edit: 28 February 2014
Shared by Ciaran Quinn 1
This resource has been shared under a Creative Commons license:
Attribution ![]()
Submit a correction to this link

Comments
How have you used this resource in your classroom? Share your teaching ideas or leave a review about this resource.
Sign in to leave a comment.
There are no comments for this resource… yet.