the MathsLinks network
Links
(current)
Faculty
Kit
Starters
Sign up for free
Sign in
Maths
Links
A directory of useful objects found on the web for teaching Maths.
Home
Browse
(current)
Topic
Australian Curriculum
NSW Curriculum
My Favourites
My Lists
Submit a link
Help
Search
Browsing by
Topic Categories
Topic:
Data
Showing:
All
Links
Downloads
Previous
7
8
9
10
11
Next Page
GeoGebra Resources for Wayne Township
Graphing Pictures on the Cartesian Plane
Growth Charts
Hands-on statistics
Hans Rosling: Don’t use news media to understand the world (english subtitles)
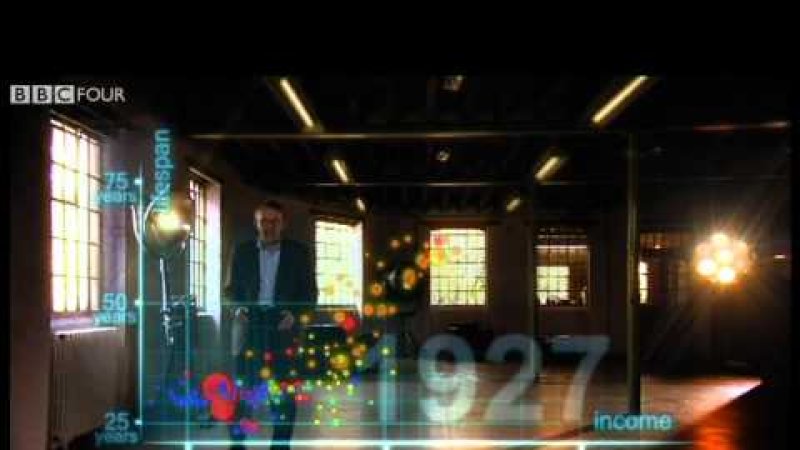
Hans Rosling’s 200 Countries, 200 Years, 4 Minutes
Height for Age Percentiles for Girls (2 - 20 years)
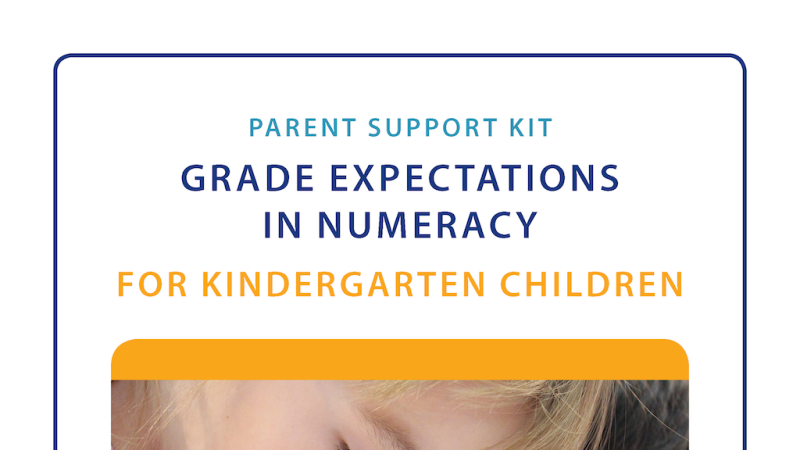
Help your child with maths
Here’s why you should (almost) never use a pie chart for your data
Previous
7
8
9
10
11
Next Page
Sign in
Email address
Password
Keep me signed in
Sign in
Get updates…
Email newsletter
Facebook
(Twitter)
Blue Sky
Pinterest
Topics
Number
Patterns and Algebra
Data
Measurement
Space and Geometry
more …
Syllabus
Australian Curriculum
NSW Syllabus