Browsing by The Australian Curriculum
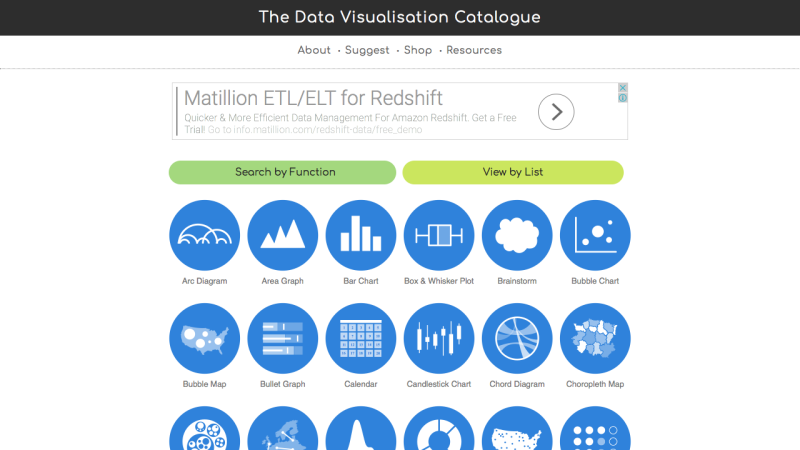
Interpret and compare a range of data displays, including side-by-side column graphs for two categorical variables (ACMSP147) * understanding that data can be represented in different ways, sometimes with one symbol representing more than one piece of data, and that it is important to read all information about a representation before making judgments * exploring ways of presenting data and showing the results of investigations, including creating dot plots with many-to-one correspondence between data and symbols * comparing different student-generated diagrams, tables and graphs, and describing their similarities and differences and commenting on the usefulness of each representation for interpreting the data


