Browsing by The Australian Curriculum
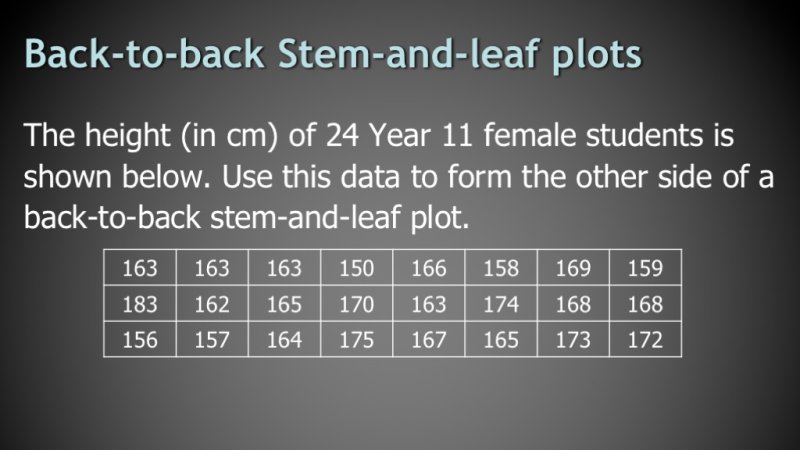
Sub-topics: ACMSP011 Foundation Answer yes/no questions to collect information (0) ACMSP048 Year 2 Identify a question of interest based on one categorical variable. Gather data relev (0) ACMSP049 Year 2 Collect, check and classify data (1) ACMSP050 Year 2 Create displays of data using lists, table and picture graphs and interpret them (0) ACMSP068 Year 3 Identify questions or issues for categorical variables. Identify data sources and pl (0) ACMSP069 Year 3 Collect data, organise into categories and create displays using lists, tables, pict (0) ACMSP070 Year 3 Interpret and compare data displays (0) ACMSP095 Year 4 Select and trial methods for data collection, including survey questions and recordi (0) ACMSP096 Year 4 Construct suitable data displays, with and without the use of digital technologies, (0) ACMSP097 Year 4 Evaluate the effectiveness of different displays in illustrating data features inclu (0) ACMSP118 Year 5 Pose questions and collect categorical or numerical data by observation or survey (2) ACMSP119 Year 5 Construct displays, including column graphs, dot plots and tables, appropriate for d (6) ACMSP120 Year 5 Describe and interpret different data sets in context (2) ACMSP147 Year 6 Interpret and compare a range of data displays, including side-by-side column graphs (4) ACMSP148 Year 6 Interpret secondary data presented in digital media and elsewhere (7) ACMSP169 Year 7 Identify and investigate issues involving continuous or large count data collected f (7) ACMSP170 Year 7 Construct and compare a range of data displays including stem-and-leaf plots and dot (6) ACMSP171 Year 7 Calculate mean, median, mode and range for sets of data. Interpret these statistics (12) ACMSP172 Year 7 Describe and interpret data displays and the relationship between the median and mea (4) ACMSP206 Year 8 Explore the practicalities and implications of obtaining representative data using a (1) ACMSP207 Year 8 Investigate the effect of individual data values, including outliers, on the mean an (5) ACMSP228 Year 9 Identify everyday questions and issues involving at least one numerical and at least (1) ACMSP248 Year 10 Determine quartiles and interquartile range (2) ACMSP249 Year 10 Construct and interpret box plots and use them to compare data sets (7) ACMSP250 Year 10 Compare shapes of box plots to corresponding histograms and dot plots (3) ACMSP251 Year 10 Use scatter plots to investigate and comment on relationships between two continuou (0) ACMSP252 Year 10 Investigate and describe bivariate numerical data where the independent variable is (7) ACMSP253 Year 10 Evaluate statistical reports in the media and other places by linking claims to dis (7) ACMSP262 Year 1 Choose simple questions and gather responses (0) ACMSP263 Year 1 Represent data with objects and drawings where one object or drawing represents one (0) ACMSP278 Year 10A Calculate and interpret the mean and standard deviation of data and use these to c (6) ACMSP279 Year 10A Use information technologies to investigate bivariate numerical data sets. Where a (5) ACMSP282 Year 9 Construct back-to-back stem-and-leaf plots and histograms and describe data, using t (7) ACMSP283 Year 9 Compare data displays using mean, median and range to describe and interpret numeric (7) ACMSP284 Year 9 Investigate techniques for collecting data, including census, sampling and observati (4) ACMSP293 Year 8 Explore the variation of means and proportions in representative data (2)