the MathsLinks network
Links
(current)
Faculty
Kit
Starters
Sign up for free
Sign in
Maths
Links
A directory of useful objects found on the web for teaching Maths.
Home
Browse
(current)
Topic
Australian Curriculum
NSW Curriculum
My Favourites
My Lists
Submit a link
Help
Search
Browsing by
The Australian Curriculum
Statistics and Probability
Topic:
Data representation and interpretation
Sub-topics:
Showing:
All
Links
Downloads
Previous
3
4
5
6
7
Next Page
Mathematics resources - Asia Education Foundation
Mean, Mode & Median (Learn MATHS with Will)
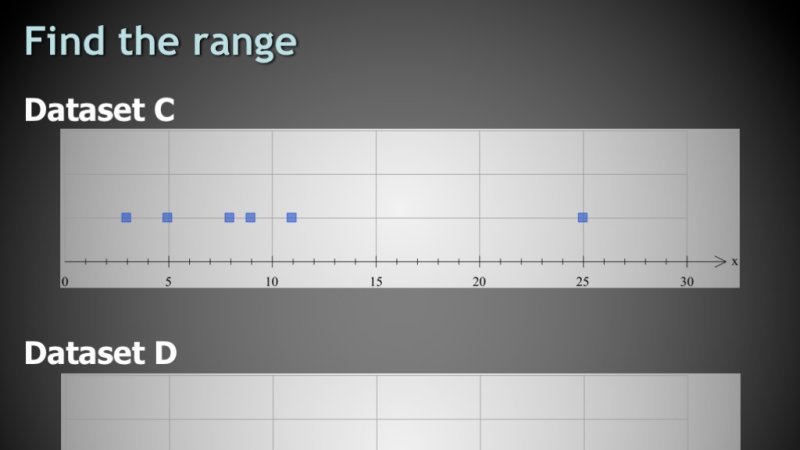
Measures of Spread
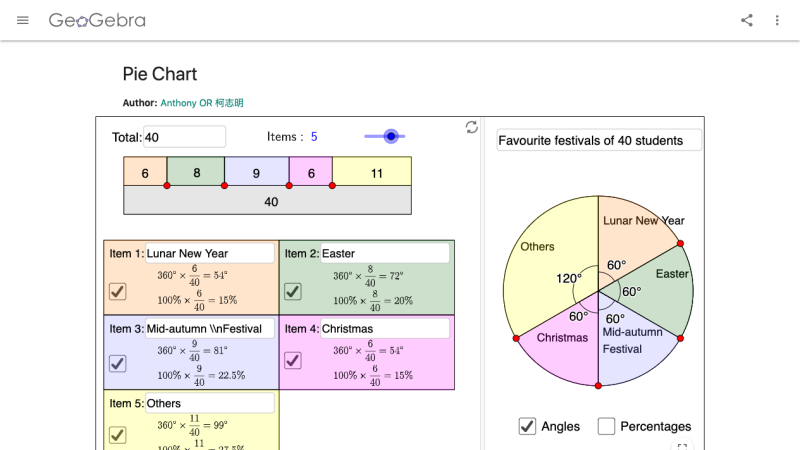
Pie Chart - Anthony OR
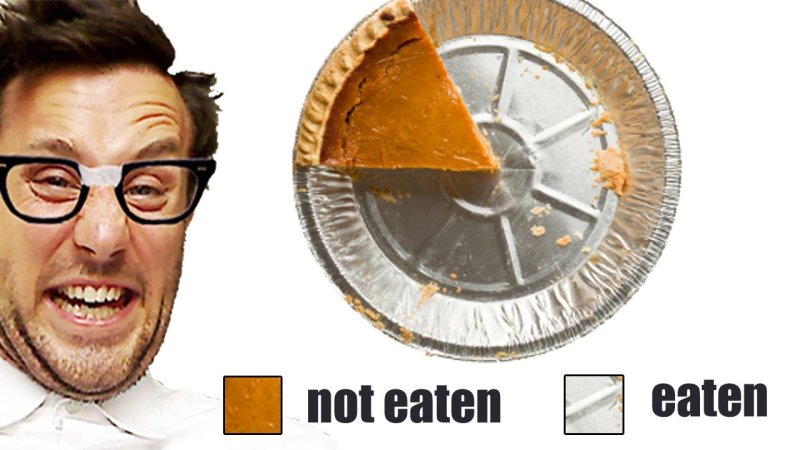
Pie Charts fo Math Nerds
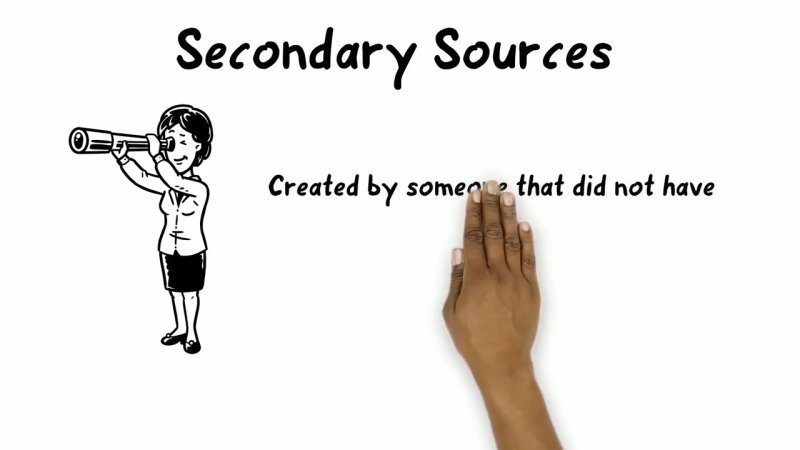
Primary and secondary data sources
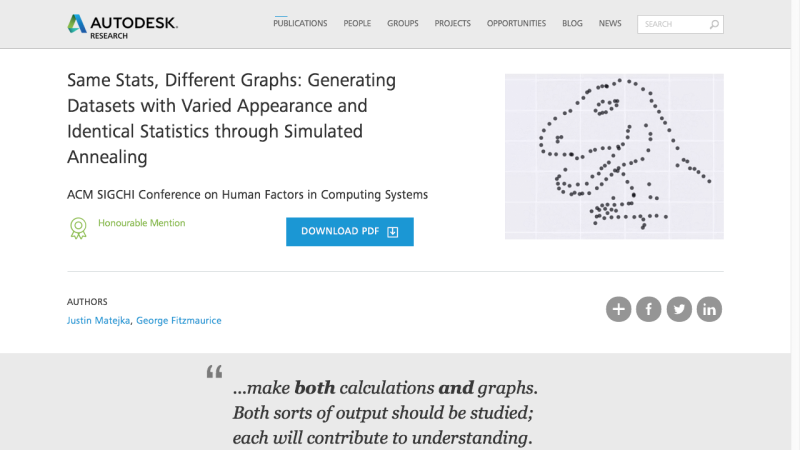
Same Stats, Different Graphs
Shut up about the y-axis. It shouldn’t always start at zero.
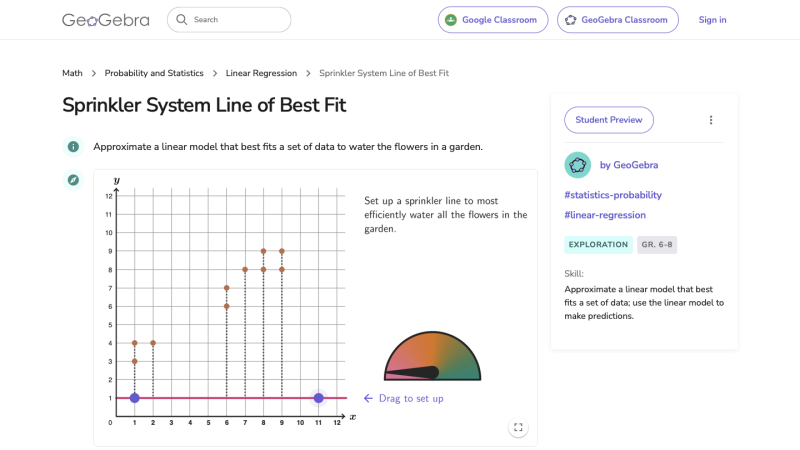
Sprinkler System Line of Best Fit
Previous
3
4
5
6
7
Next Page
Sign in
Email address
Password
Keep me signed in
Sign in
Get updates…
Email newsletter
Facebook
(Twitter)
Blue Sky
Pinterest
Topics
Number
Patterns and Algebra
Data
Measurement
Space and Geometry
more …
Syllabus
Australian Curriculum
NSW Syllabus