Same Stats, Different Graphs
https://www.autodeskresearch.com/publications/samestats
Interesting, Publisher, Flowing Data, Stimulus
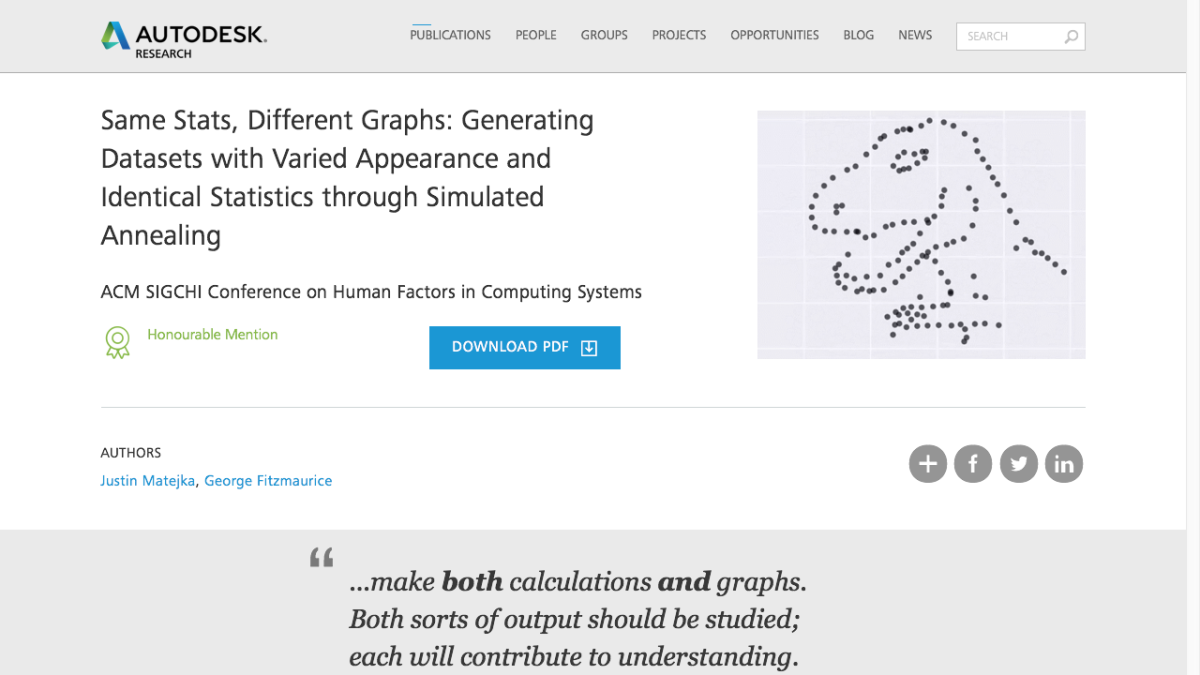
Four clearly different and visually distinct datasets produce the same summary statistics.
Check out the Datasaurus Dozen. While different in appearance, each dataset has the same summary statistics (mean, standard deviation, and Pearson's correlation) to two decimal places.
via Flowing Data
7 May 2017 Edit: 27 November 2019
- Topics:
- Data, Data Analysis, Data Representation
- Content Type:
- Interesting, Publisher, Flowing Data, Stimulus
- The Australian Curriculum
- Statistics and Probability, Data representation and interpretation, ACMSP171 Year 7 Calculate mean, median, mode and range for sets of data. Interpret these statistics , ACMSP253 Year 10 Evaluate statistical reports in the media and other places by linking claims to dis
- The Australian Curriculum Version 9.0
- Year 7, Statistics Year 7, AC9M7ST01 acquire data sets for discrete and continuous numerical variables and calculate the range,, Year 10, Statistics Year 10, AC9M10ST01 analyse claims, inferences and conclusions of statistical reports in the media, including
- Australian Curriculum / General Mathematics
- Unit 2 Topic 1 Univariate data analysis and the statistical investigation process, Making sense of data relating to a single statistical variable, ACMGM030 determine the mean and standard deviation of a dataset and use these statistics as me…
- NSW Mathematics Standard Stage 6 Syllabus
- Statistical Analysis, MS-S3 Further Statistical Analysis, MS-S3.2 Exploring and describing data arising from two quantitative variables, MS-S4 Bivariate Data Analysis
- NSW Mathematics Advanced Stage 6 Syllabus
- Statistical Analysis, MA-S2 Descriptive Statistics and Bivariate Data Analysis, S2.2 Bivariate data analysis
- NSW Mathematics Standard 11-12 Syllabus (2024) New
- Statistics, Bivariate data analysis, Bivariate data analysis
- NSW Mathematics Advanced 11-12 Syllabus (2024) New
- Statistical analysis
Submit a correction to this link
Comments
How have you used this link in your classroom? Share your teaching ideas or leave a review about this link.
Sign in to leave a comment.
There are no comments for this link.