the MathsLinks network
Links
(current)
Faculty
Kit
Starters
Sign up for free
Sign in
Maths
Links
A directory of useful objects found on the web for teaching Maths.
Home
Browse
(current)
Topic
Australian Curriculum
NSW Curriculum
My Favourites
My Lists
Submit a link
Help
Search
Browsing by
The Australian Curriculum Version 9.0
Year 6
Topic:
Statistics Year 6
Showing:
All
Links
Downloads
1
2
Next Page
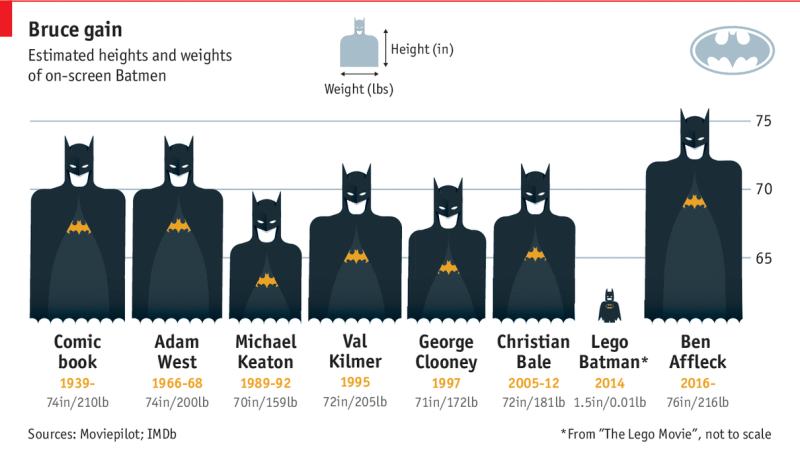
Bruce gain - heights and weights of on-screen Batmen
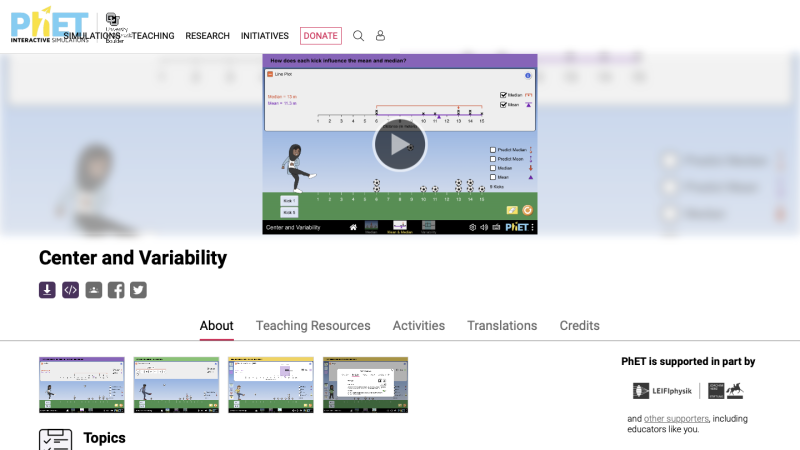
Center and Variability
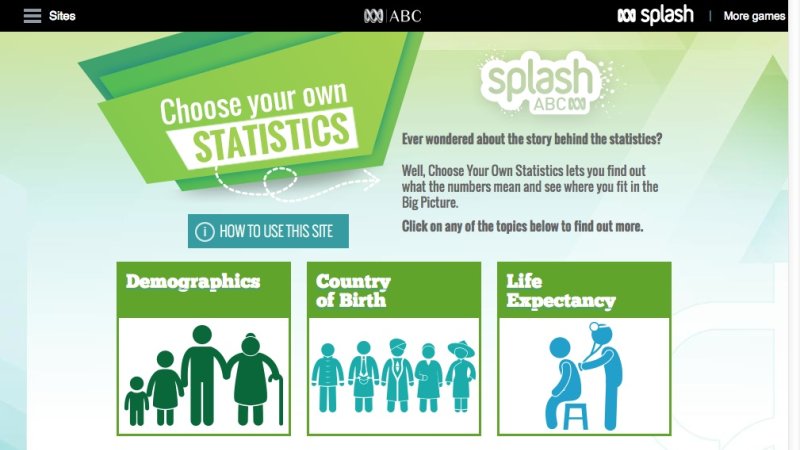
Choose Your Own Statistics
Displaced Axis example, TV Ad
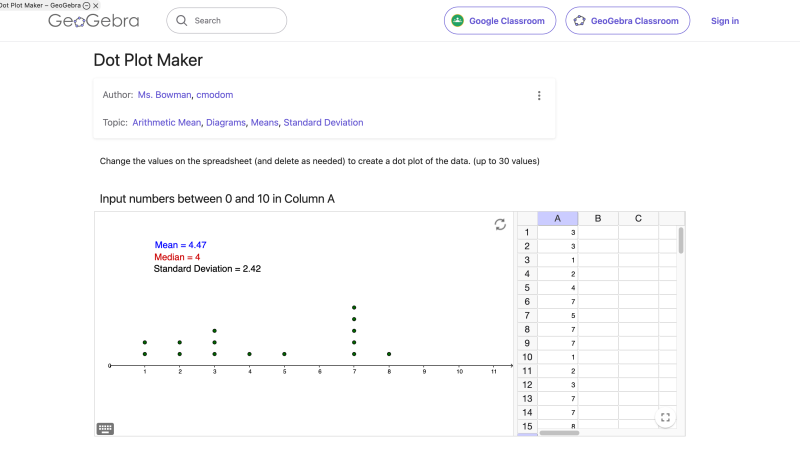
Dot Plot Maker
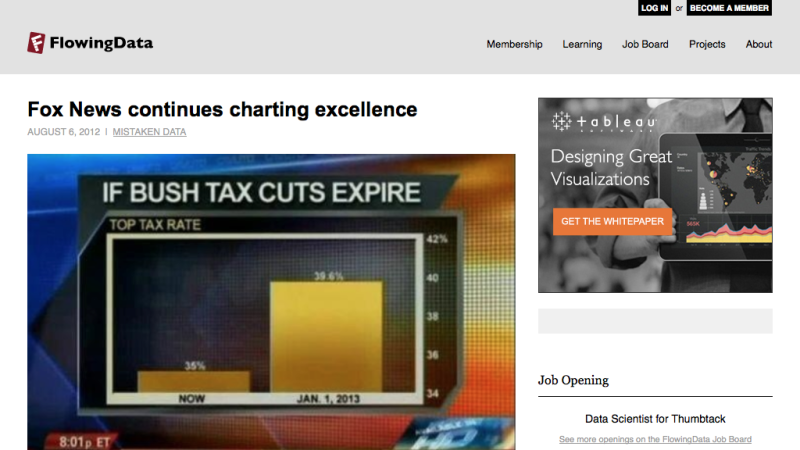
Fox News continues charting excellence
Here’s why you should (almost) never use a pie chart for your data
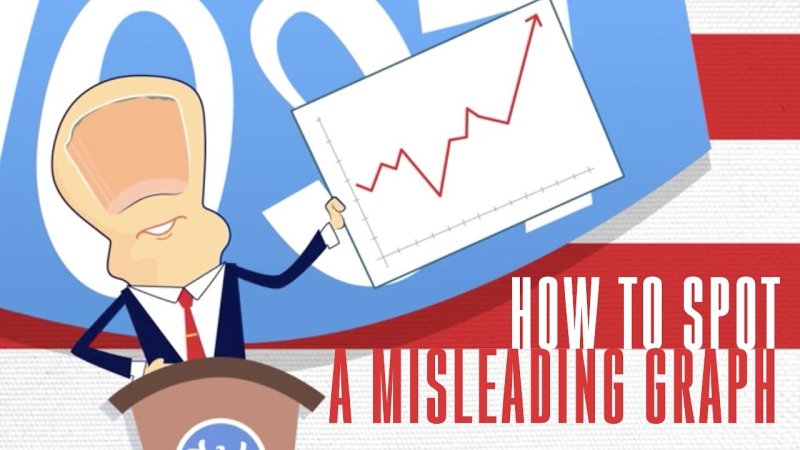
How to spot a misleading graph
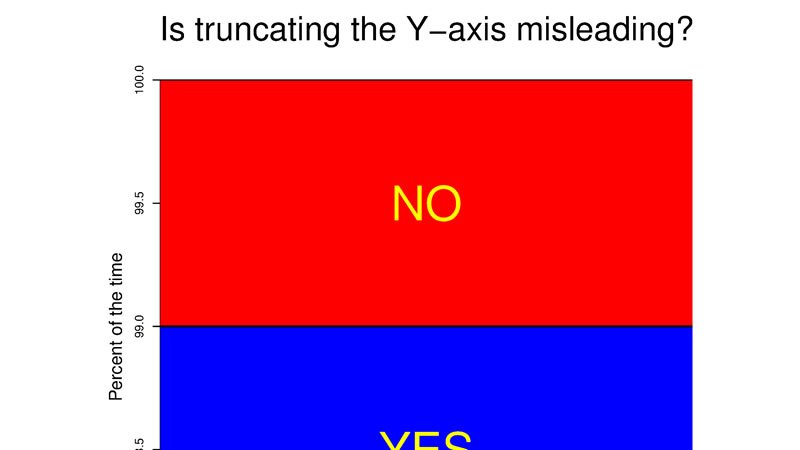
Is truncating the Y-axis misleading
1
2
Next Page
Sign in
Email address
Password
Keep me signed in
Sign in
Get updates…
Email newsletter
Facebook
(Twitter)
Blue Sky
Pinterest
Topics
Number
Patterns and Algebra
Data
Measurement
Space and Geometry
more …
Syllabus
Australian Curriculum
NSW Syllabus