the MathsLinks network
  • Links (current)
  • Faculty
  • Kit
  • Starters
Sign up for free Sign in

MathsLinks

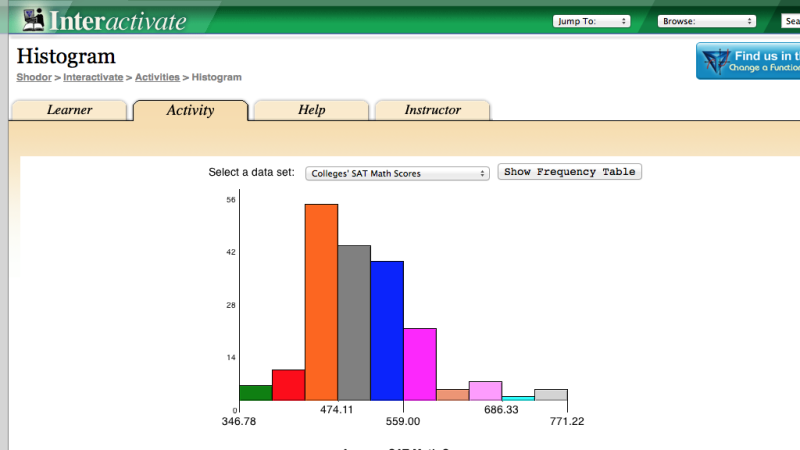
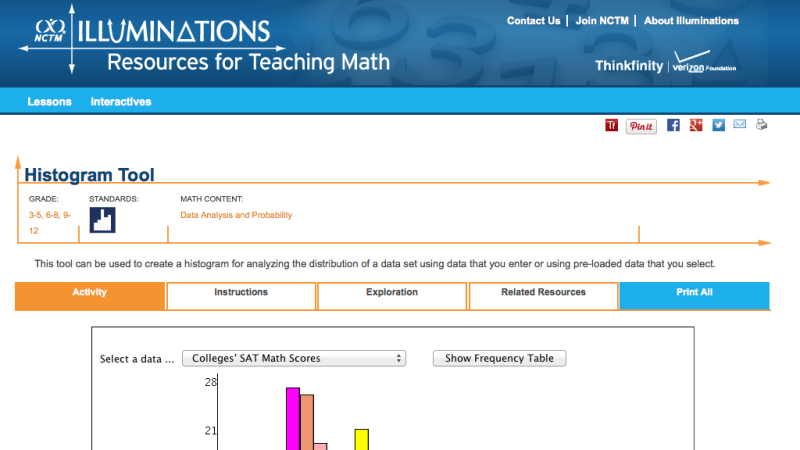
A directory of useful objects found on the web for teaching Maths.

  • Home
  • Browse (current)
    Topic Australian Curriculum NSW Curriculum
  • My Favourites
  • My Lists
  • Submit a link
  • Help

Browsing by NSW Curriculum

  1. Data classification, visualisation and analysis
  2. Topic: MA5-DAT-C-02 Data analysis B

displays and interprets datasets involving bivariate data

  • Showing:
  • All
  • Links
  • Downloads
  • Previous
  • 1
  • 2
  • 3
  • Next Page
Screenshot of Histogram Tool
Histogram Tool
Screenshot of How the Average Triumphed Over the Median
How the Average Triumphed Over the Median
Screenshot of Is truncating the Y-axis misleading
Is truncating the Y-axis misleading
Screenshot of Japanese train time table
Japanese train time table
Screenshot of Mathematics resources - Asia Education Foundation
Mathematics resources - Asia Education Foundation
Screenshot of Misleading Graphs
Misleading Graphs
Screenshot of Misleading Graphs (American)
Misleading Graphs (American)
Screenshot of Rock ‘n Poll
Rock ‘n Poll
Screenshot of Shut up about the y-axis. It shouldn’t always start at zero.
Shut up about the y-axis. It shouldn’t always start at zero.
  • Previous
  • 1
  • 2
  • 3
  • Next Page

Sign in

Forgot your password?
Get updates…
Email newsletter Facebook (Twitter) Blue Sky
Topics
    Number Patterns and Algebra Data Measurement Space and Geometry more …
Syllabus
    Australian Curriculum NSW Syllabus

Blue Sky (Twitter) Facebook Pinterest Subscribe to feed Email newsletter

the MathsLinks network © 2007–2025 Simon Job | Contact | About

Hosted on Dreamhost. follow.it for email newsletter. Overleaf for LaTeX.

This site was created in a private capacity and is not the work of my employer.