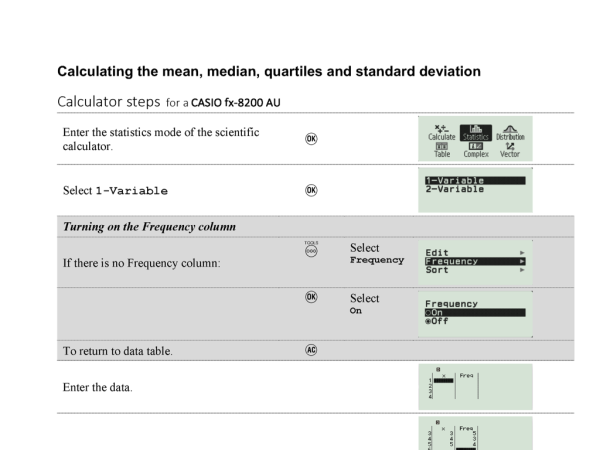
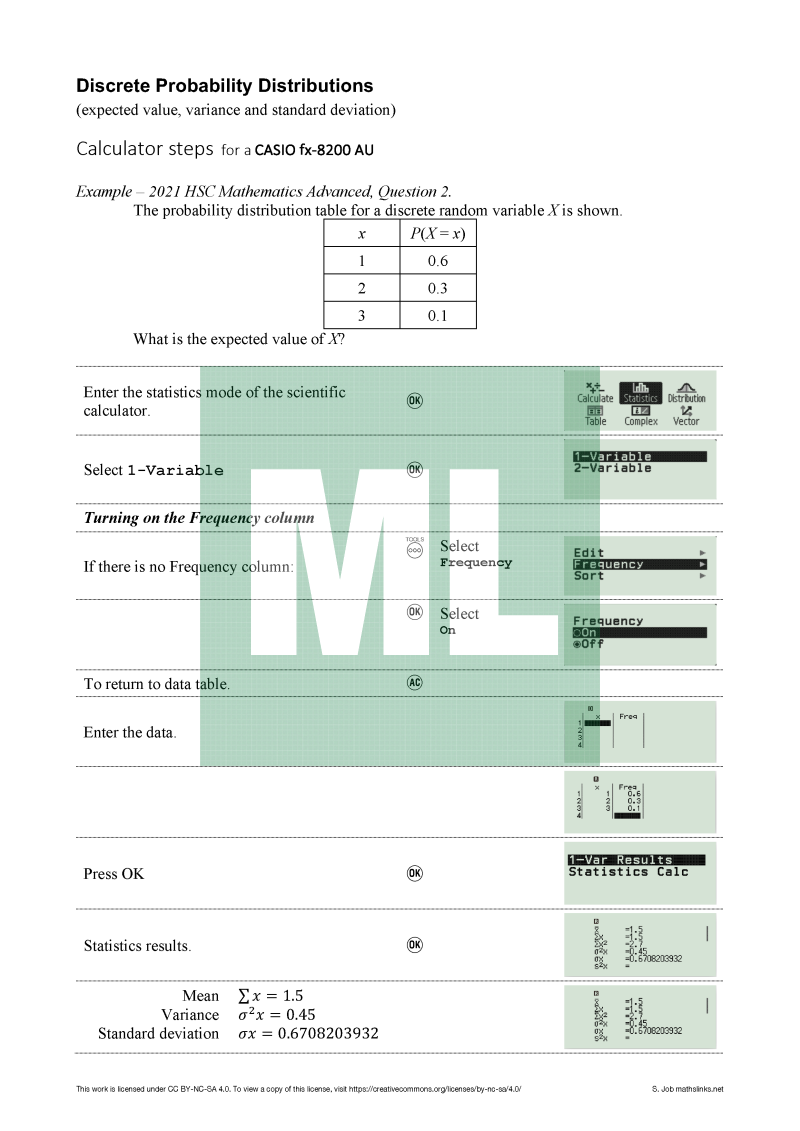
Calculator steps for statistics on a Casio fx8200 AU
Resource Type: Worksheet - Print
Instruction sheets that could be provided to students for calculating
- mean
- median
- quartiles
- standard deviation
- correlation coefficient
- line of best fit
on a Casio fx8200 AU.
Added, calculating Expected Value, Variance and Standard Deviation for a discrete probability distribution.
7 Sep 2024: Added instructions for discrete probability distributions.
2 August 2024 Edit: 7 September 2024
Shared by Simon Job Sydney, Australia
This resource has been shared under a Creative Commons license:
Attribution-Noncommercial-Share Alike ![]()
Click thumbnails for selected previews.


- Topics:
- Data, Data Analysis, Bivariate data, General, Calculator
- Resource Type:
- Worksheet - Print
- The Australian Curriculum
- Statistics and Probability, Data representation and interpretation, ACMSP171 Year 7 Calculate mean, median, mode and range for sets of data. Interpret these statistics , ACMSP207 Year 8 Investigate the effect of individual data values, including outliers, on the mean an, ACMSP283 Year 9 Compare data displays using mean, median and range to describe and interpret numeric, ACMSP252 Year 10 Investigate and describe bivariate numerical data where the independent variable is, ACMSP278 Year 10A Calculate and interpret the mean and standard deviation of data and use these to c
- The Australian Curriculum Version 9.0
- Year 7, Statistics Year 7, Year 8, Statistics Year 8, Year 9, Statistics Year 9, Year 10, Statistics Year 10
- Australian Curriculum / Essential Mathematics
- Unit 2 Topic 1 Representing and comparing data, Summarising and interpreting data, ACMEM055 calculate and interpret statistical measures of spread, such as the range, interquartile ra
- Australian Curriculum / General Mathematics
- Unit 2 Topic 1 Univariate data analysis and the statistical investigation process, Making sense of data relating to a single statistical variable, ACMGM030 determine the mean and standard deviation of a dataset and use these statistics as me…
- NSW Curriculum K - 10
- Statistics and probability, Data classification, visualisation and analysis, MA4-DAT-C-02 Data analysis, MA5-DAT-C-01 Data analysis A, MA5-DAT-C-02 Data analysis B, MA5-DAT-P-01 Data analysis C (Path)
- NSW Mathematics Standard Stage 6 Syllabus
- Statistical Analysis, MS-S1 Data Analysis, MS-S1.2 Summary statistics, MS-S4 Bivariate Data Analysis
- NSW Mathematics Advanced Stage 6 Syllabus
- Statistical Analysis, MA-S2 Descriptive Statistics and Bivariate Data Analysis, S2.1 Data (grouped and ungrouped) and summary statistics, S2.2 Bivariate data analysis
- NSW Mathematics Standard 11-12 Syllabus (2024) New
- Statistics, Data analysis, Measures of centre and spread, Bivariate data analysis
- NSW Mathematics Advanced 11-12 Syllabus (2024) New
- Statistical analysis, Data
Submit a correction to this link
Comments
How have you used this resource in your classroom? Share your teaching ideas or leave a review about this resource.
Sign in to leave a comment.
There are no comments for this resource… yet.