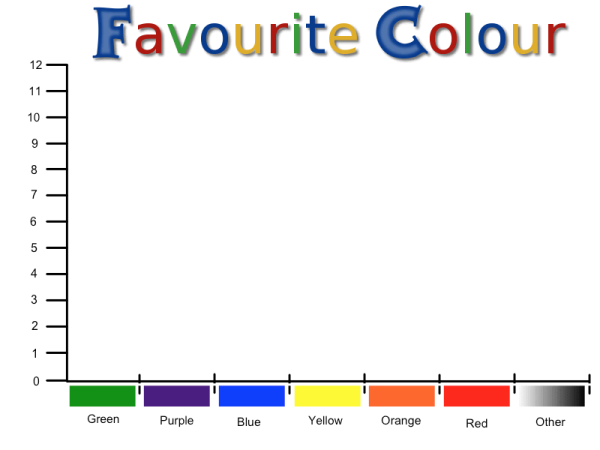
Favourite Colour - Bar Graph

Resource Type: IWB, Interactive, Manipulative
A very simple bar graph in SMART Notebook for data introduction/revision.
The title and both axes' labels are hidden until tapped on. This opens up discussion about parts of a graph. The colours on the X axis are infinite cloners.
17 February 2013 Edit: 28 February 2014
Shared by nmac
This resource has been shared under a Creative Commons license:
Attribution-Noncommercial-Share Alike ![]()
SMART Notebook
- Topics:
- Data, Column Graph
- Resource Type:
- IWB, Interactive, Manipulative
- The Australian Curriculum
- Statistics and Probability, Data representation and interpretation, ACMSP119 Year 5 Construct displays, including column graphs, dot plots and tables, appropriate for d
- The Australian Curriculum Version 9.0
- Year 5, Statistics Year 5, AC9M5ST01 acquire, validate and represent data for nominal and ordinal categorical and discrete nume
Submit a correction to this link

Comments
How have you used this resource in your classroom? Share your teaching ideas or leave a review about this resource.
Sign in to leave a comment.
There are no comments for this resource… yet.