the MathsLinks network
  • Links (current)
  • Faculty
  • Kit
  • Starters
Sign up for free Sign in

MathsLinks

A directory of useful objects found on the web for teaching Maths.

  • Home
  • Browse (current)
    Topic Australian Curriculum NSW Curriculum
  • My Favourites
  • My Lists
  • Submit a link
  • Help

Browsing by NSW Curriculum

  1. Data classification, visualisation and analysis
  2. Topic: MA4-DAT-C-01 Data classification and visualisation

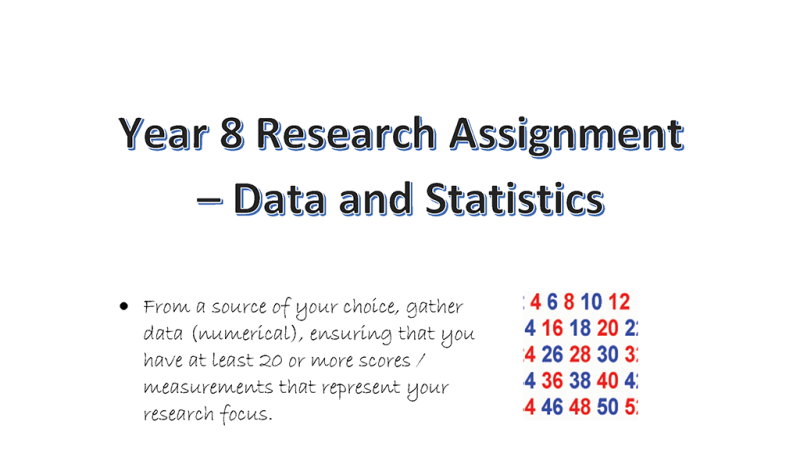
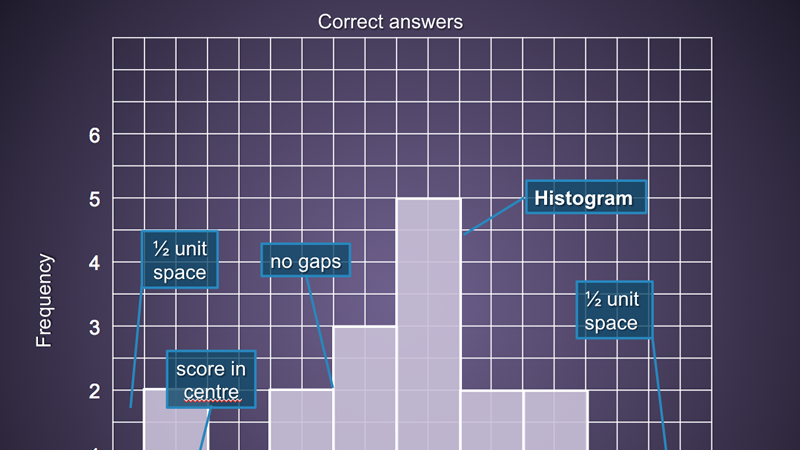
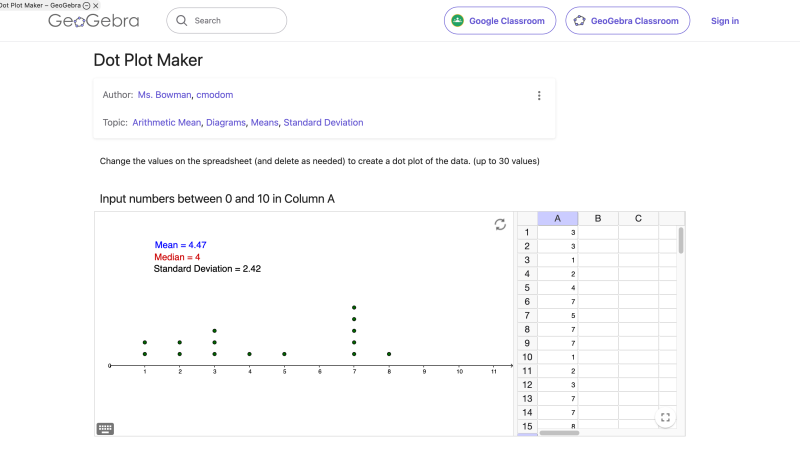
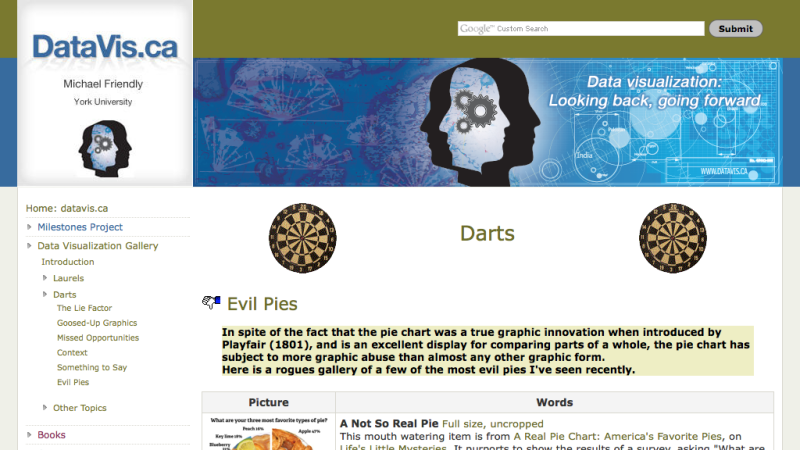
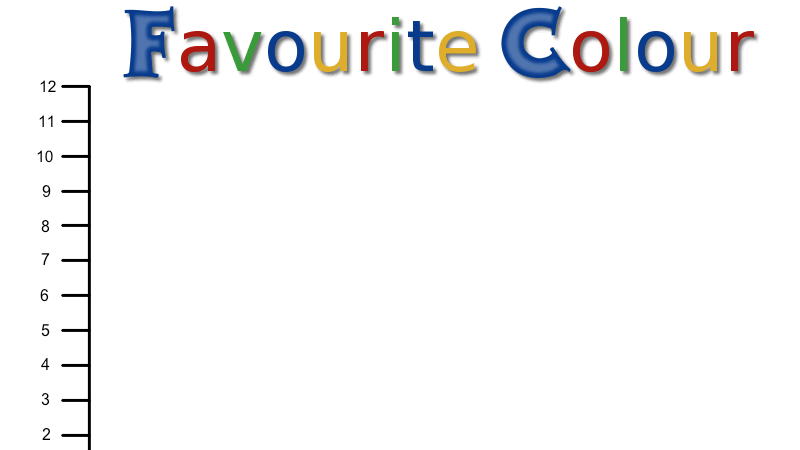
classifies and displays data using a variety of graphical representations

  • Showing:
  • All
  • Links
  • Downloads
  • Previous
  • 1
  • 2
  • 3
  • 4
  • 5
  • Next Page
Screenshot of Dancing Statistics: Variance
Dancing Statistics: Variance
Preview of Data Collection and Analysis Research Assignment Stage 4
Data Collection and Analysis Research Assignment Stage 4
Preview of Data Tools - Demonstration and Student Activity
Data Tools - Demonstration and Student Activity
Screenshot of Displaced Axis example, TV Ad
Displaced Axis example, TV Ad
Screenshot of Dot Plot Maker
Dot Plot Maker
Screenshot of Evil Pies
Evil Pies
Screenshot of Facebook Statistics
Facebook Statistics
Preview of Favourite Colour - Bar Graph
Favourite Colour - Bar Graph
Screenshot of Flags By Colours
Flags By Colours
  • Previous
  • 1
  • 2
  • 3
  • 4
  • 5
  • Next Page

Sign in

Forgot your password?
Get updates…
Email newsletter Facebook (Twitter) Blue Sky
Topics
    Number Patterns and Algebra Data Measurement Space and Geometry more …
Syllabus
    Australian Curriculum NSW Syllabus

Blue Sky (Twitter) Facebook Pinterest Subscribe to feed Email newsletter

the MathsLinks network © 2007–2025 Simon Job | Contact | About

Hosted on Dreamhost. follow.it for email newsletter. Overleaf for LaTeX.

This site was created in a private capacity and is not the work of my employer.